Sometimes you just need to run network performance tests between two hosts. While there are tools available for running speed tests such as iPerf, they're often annoying to setup, confusing to use, and require console access to the server itself in order to test.
Here's where the IITG Web-based iPerf containers come into play. With this guide, you can setup iPerf servers in multiple locations and allow network support staff to perform network testing without the need to give them console access to the server itself.
Let's get started!
Installation
Install web interface, iperf-servers and iperf command
If the URL you will be using to access the iperf web interface does not match the fully qualfied domain name of your docker container host, make sure you set FQDN_SERVER_NAME to something more meaningful.
Set a variable to contain the hostname
FQDN_SERVER_NAME="`hostname`"
By default iperf-web exposes port 80. That's not necessary since we'll use a self signed certificate and HTTPS later on. You can manually edit the /data/iperf-web/docker-compose.yml file to disable exposing port 80 to the outside world or just recreate from scratch using the code below
Reconfigure iperf-web docker-compose.yml file
cat | sudo tee /data/iperf-web/docker-compose.yml <<EOF
server:
image: iitgdocker/iperf-web:latest
volumes:
- /var/run/docker.sock:/var/run/docker.sock
- /data/iperf-web/images:/var/www/html/images
environment:
- VIRTUAL_HOST=${FQDN_SERVER_NAME}
EOF
Configure An Nginx Web Server
Assuming you don't already run your own webserver on the host, we'll use a docker container for that too. This one will automatically regenerate and reload nginx whenever a compatible container is detected. This is based on jwilders nginx proxy. You can find more detailed information on how to use it here: https://github.com/jwilder/nginx-proxy.
If you're running on the free version of VMware ESX 5 then you know the pangs of having to manually perform operations which are much easier to do with VMware Essentials or higher licenses.
This is not really a guide, more it's a collection of useful command line utilities which you can use to save yourself some time.
Initiate auto-shutdown of VMs
/bin/vmware-autostart.sh stop
Note: This requires VMware tools (and running) and auto shutdown rules configured
Initiate auto power on of VMs
/bin/vmware-autostart.sh start
Note: This requires VMware tools (and running) on the VM and auto shutdown rules configured
Unregister multiple VMs
for vm in <vm_name>; do vim-cmd /vmsvc/unregister /vmfs/volumes/<volume_name>/${vm}/${vm}.vmx; done
Note: This is the same as "Remove from inventory"
Register multiple VMs
for vm in <vm_name>; do vim-cmd /solo/register /vmfs/volumes/<volume_name>/${vm}/${vm}.vmx; done
Note: This is the same as "Add to inventory"
Power on multiple VMs
for vm in <vm_name>; do vim-cmd /vmsvc/power.on /vmfs/volumes/<volume_name>/${vm}/${vm}.vmx; done
There are many ways to tune TCP window sizes, below i show you how i do it. Feel free to comment.
First of all a few things need to be known prior to tuning. They are:
The amount of bandwidth available in Kb
The average ping response time between the source and destination hosts (in ms)
The maximum TCP segment size
For the purpose of this article, let's set some numbers of our own
Bandwidth (Kb)
20,000
Ping Time (ms)
340
Max Segment Size
1300
Note: To make full use of receive or even transmit window size tuning, BOTH hosts should be tuned.
First of all, we need to find the current settings for the following parameters:
sysctl net.ipv4.tcp_window_scaling
sysctl net.ipv4.tcp_slow_start_after_idle
sysctl net.ipv4.tcp_rmem
sysctl net.ipv4.tcp_wmem
sysctl net.core.rmem_default
sysctl net.core.wmem_default
sysctl net.core.rmem_max
sysctl net.core.wmem_max
sysctl net.core.optmem_max
sysctl net.core.netdev_max_backlog
sysctl net.ipv4.tcp_congestion_control
sysctl net.ipv4.tcp_timestamps
sysctl net.ipv4.tcp_sack
As an example, this is the output when running those commands on our test system:
net.ipv4.tcp_window_scaling = 1
net.ipv4.tcp_slow_start_after_idle = 1
net.ipv4.tcp_rmem = 4096 87380 4194304
net.ipv4.tcp_wmem = 4096 16384 4194304
net.core.rmem_default = 124928
net.core.wmem_default = 124928
net.core.rmem_max = 124928
net.core.wmem_max = 124928
net.core.optmem_max = 20480
net.core.netdev_max_backlog = 1000
net.ipv4.tcp_congestion_control = cubic
net.ipv4.tcp_timestamps = 1
net.ipv4.tcp_sack = 1
We’re only going to do receive window tuning so ignore the wmem parameters (it’s the same process anyway but requires bi-directional access in order to test).
Calculating The Optimal Window Size
First we need to find our BDP or Bandwidth Delay Product.
Start by multiplying the amount of bandwidth available (in our case, is 20000) by the ping response time (340ms). This gives us 6800000. Divide this by 8 and we have our BDP which is 850000.
Now we need to find our unscaled window value.
Take 65535 (why 65535? I don’t know) and divide it by our MSS (1300) and round down the result to the nearest even number. 65535 / 1300 is 50.41153846153846. Rounded down to the nearest even number brings us to 50. Then, multiply this value by 1300 (our MSS) to find the optimal unscaled window value which is 65000.
Still following? Hope so.
Multiply 65000 by 2 until it is larger than our BDP (which is 850000) and you should arrive at 1040000 which is your optimal window size. You can’t use 1040000 because it’s not a valid number. I usually divide it by 1024 and round up the result to the nearest whole number. In our case, 104000 / 1024 is 1015.625 which when rounded up is 1016. 1024 * 1016 = 1040384 which after all that is now our default window size. That’s just the method I use but you can do more research if you want to but I find it easy to remember especially since 1024 is usually the default minimum value given when you dump the current configuration.
We also need to set a minimum window size and a maximum window size. To save you some time and effort, use 16MB or 16777216 which is the maximum for a 1Gb/s local network link. Of course, if the server has a larger local network link ie 10Gb/s the maximum should be at least double that.
Minimum receive window size can be set where ever you want. Set this value too high and It will cause problems because there isn’t enough memory available to handle your minimum.
The Optimised Values
Note that this also includes write optimisation (wmem) values as well because i find myself referencing this documentation a lot.
# Turn on automatic TCP window size scaling
sysctl -w net.ipv4.tcp_window_scaling=1
# Disable TCP slow start
sysctl -w net.ipv4.tcp_slow_start_after_idle=0
# Set the min, default and maximum receive window sizes used during auto tuning
The aim of this task is to re-evaluate the viability of ZFS in our environment. Concerns were raised over the original test results such as;
IO statistics grossly exceed expectations (Could have been influenced by system RAM)
Multiple ZFS deadlocks occurring (Possibly due to CPU/RAM contention on the test system)
Disk usage savings did not meet or exceed expectations (Possibly due to limiting the amount of user data copied to the machine)
Although the hardware is exactly the same as the previous ZFS test hardware, the results from this round of testing cannot be merged with previous results due to:
Changes in drive/raid configuration
ZFS record size is set to default (128K)
Test server does not have access to the Nimble CS215 SAN
Hardware Configuration
The hardware being used for this test is a Dell PowerEdge R720 server with the following hardware configuration:
OS storage configuration - 600GB raw storage consisting of 2 x 600GB 15K RPM SAS 6Gbps 2.5in drives in RAID 1
Data Storage configuration - 1.8TB raw storage consisting of 6 x 600GB 15K RPM SAS 6Gbps 2.5in drives in RAID 10
ZFS Benchmark Setup
Because we're using the Dell PERC H710p Integrated RAID Controller, we can't configure ZFS exactly how it prefers to be configured. This would otherwise require JBOD mode, which the H710p card doesn't support. To remedy this, we would need to purchase a PowerVault MD12xx direct attached storage enclosure which includes a PERC H810 RAID Adapter card that does support JBOD mode or (even better) a HBA where ZFS has complete control over the entire world. The more information ZFS
We'll also be performing tests with ZFS primarycache set to "all", "metadata" and "none". Just so you are aware, these are the commands you'll need to know in order to change the primarycache setting for the entire pool.
Changing the primarycache to "all"
zfs set primarycache=all zfs
Create the ZFS pool using /dev/sdb for testing purposes. This will create ~1.62TB storage pool.
zpool create zfs /dev/sdb
Create ZFS volume with de-duplication turned on and atime turned off as recommended by some best practices guides.
zfs create -o de-dup=on -o atime=off zfs/data
Mount the ZFS volume
zfs mount zfs/data /data
Test Data
All access to /data is severed to ensure the data contained remained consistent and the tests are not influenced by end users.
There's two types of test data
Compile data
User data
Compile Data
This is a piece of software to be compiled. To be fair, this could be any piece of software which could be compiled under Linux but the more organisational specific it is, the more relatable it will be to the end users. Since this machine will store software that needs to be compiled anyway, it makes sense to perform a couple of timed compilation tests.
The test data is stored under /data (wherever is convenient) and will be accessed from a remote "helper" server via NFS. More on that later..
.
User Data
This is the reason why we're here. How much of this data can fit into 1.8TB of raw storage. Our users data (known herein as user data) will be migrated via rsync to the test server. How many exactly? enough to fill 100% of the space available. That should be quite a bit... we might not have enough data.
Testing Process
A total of 3 tests will be performed. All of which are outlined below;
Compilation Speed
Disk Space Consolidation
IO Tests
Compilation Speed
This test aims to compare ZFS using an organisational specific metric that everyone is able to understand - software compilation times. The compilation test is executed three times, timed and the resulting run times are then averaged. Flock is used to make sure that compilation times are not influenced by cache.
This test requires the use of a "helper" server. This server should be be unused and ideally connected to the same network switch as the test server. This is to ensure that the testing environment remains consistent throughout the test.
Also since we'll be accessing the data via NFS, it's important set the mount options exactly as they are in production. Failure to do so could impact test results.
From within the testing directory, execute the following:
flock /tmp/compile.lock -c "make veryclean && time make -j `grep processor
-c /proc/cpuinfo`"
Results
The results show that there is very little performance difference when using ZFS with in-line deduplication. This is very interesting because the previous compile tests showed a 25% difference which i now believe was due to the fact that we were attempting a CPU intensive workload on the same machine which was running ZFS. For me, it's validation that says we should never use a ZFS server for anything other than ZFS unless it's absolutely necessary.
Run 1
Run 2
Run 3
Average
% Difference
EXT4 Logical Volume
366
380
371
372
+00.00%
ZFS Primary Cache: all
388
364
370
374
+00.54%
ZFS Primary Cache: metadata
520
599
568
562
+51.08%
ZFS Primary Cache: none
626
654
634
638
+71.51%
Disk Space Consolidation
Given the original filesystem was ext4 based, obviously, it had 0 disk space consolidation savings. What we're really after is a figure that tells us how much user data we've been able to cram into our ZFS volume.
ZFS
Since we only have 1.8TB of raw space and some of that gets eaten up by system overheads, we're left with 1.62TB of available disk space for the ZFS pool. ]The ZFS pool seems to reserve some of this space so the pool can never grow beyond 90% capacity. This leaves us with only 1.46TB of usable disk space.
When deduplication and/or compression is enabled, it's hard to know exactly how much of that 1.46TB you've really used. The command below will tell you but to be honest, if the df command tells you the disk is full, it's damn well full.
This commands will tell you how much of your 1.46TB has actually been consumed.
zpool get allocated zfs
Results
As was explained earlier, we could only fill the pool to just under 90% capacity. As you can see from the graph below, we managed to squeeze in an impressive 5.19TB of real user data onto the our 1.46TB of available disk space. That's a 71.87% reduction with a deduplication ratio of 3.59x ! At the time of writing (and for comparison purposes) we have 8TB of user data currently spread across two hosts with roughly 300GB saved due to the in-line compression provided by the Nimble SAN.
The test names are important because my shitty bash script uses them to pull out the information and populate CSV files to make it easier to copy and paste into this report.
[global]
ioengine=libaio
bs=4k
# This must be set to 0 for ZFS. 1 for all others.
direct=${DIRECT}
# This must be set to none for ZFS. posix for all others.
fallocate=${FALLOCATE}
rw=randrw
# Make sure fio will refill the IO buffers on every submit rather than just
init
refill_buffers
# Setting to zero in an attempt to stop ZFS from skewing results via
de-dupe.
#dedupe_percentage=0
# Setting to zero in an attempt to stop both ZFS and Nimble from skewing
results via compression.
buffer_compress_percentage=0
norandommap
randrepeat=0
rwmixread=70
runtime=60
ramp_time=5
group_reporting
directory=${DIRECTORY}
filename=fio_testfile
time_based=1
runtime=60
[16t-rand-write-16q-4k]
name=4k100writetest-16t-16q
rw=randrw
bs=4k
rwmixread=0
numjobs=16
iodepth=16
In order to make use of the file, you'll need fio and libaio-devel installed. There's no rpm for fio so you need to download it and compile yourself.
What do the results say? Well, the default value for primarycache is "all". The results tell you that modifying this value is a bad idea so leave it set to the default value and instead buy enough RAM to store everything in memory. De-duplicated data is considered "metadata" so it will fight for a piece of your cache. In addition to this, you also need space for the actual hash table and whatever else ZFS stores in its cache. A more detailed explanation can be found here: http://open-zfs.org/wiki/Performance_tuning#Deduplication but the basic rule of thumb is more RAM = less problems.
The results also show that in the majority of cases with the ZFS primary cache set to "all" performed better than the EXT4 logical volume. This was expected since the primary cache is using RAM after all.
4K Random 100% Read/Write Test [Throughput]
16 Thread 16 Queue 100% Read
16 Thread 16 Queue 100% Write
EXT4 Logical Volume
51680
6545
ZFS Primary Cache: all
43770
56024
ZFS Primary Cache: metadata
3386
502
ZFS Primary Cache: none
1552
498
4K Random 100% Read/Write Test [Average Latency]
16 Thread 16 Queue 100% Read
16 Thread 16 Queue 100% Write
EXT4 Logical Volume
4
39
ZFS Primary Cache: all
5
4
ZFS Primary Cache: metadata
76
509
ZFS Primary Cache: none
165
509
4K Random 100% Read/Write Test [Max Latency]
16 Thread 16 Queue 100% Read
16 Thread 16 Queue 100% Write
EXT4 Logical Volume
733
739
ZFS Primary Cache: all
287
52
ZFS Primary Cache: metadata
1357
1435
ZFS Primary Cache: none
402
3080
4K Random 100% Read/Write Test [Standard Deviation]
16 Thread 16 Queue 100% Read
16 Thread 16 Queue 100% Write
EXT4 Logical Volume
10
27
ZFS Primary Cache: all
9
5
ZFS Primary Cache: metadata
36
229
ZFS Primary Cache: none
32
349
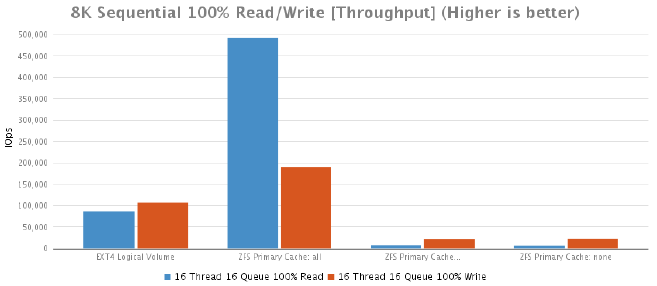
8K Sequential 100% Read/Write Test [Throughput]
16 Thread 16 Queue 100% Read
16 Thread 16 Queue 100% Write
EXT4 Logical Volume
86532
106972
ZFS Primary Cache: all
492187
189733
ZFS Primary Cache: metadata
7496
22249
ZFS Primary Cache: none
6758
22798
8K Sequential 100% Read/Write Test [Average Latency]
16 Thread 16 Queue 100% Read
16 Thread 16 Queue 100% Write
EXT4 Logical Volume
2
2
ZFS Primary Cache: all
1
1
ZFS Primary Cache: metadata
34
12
ZFS Primary Cache: none
37
11
8K Sequential 100% Read/Write Test [Max Latency]
16 Thread 16 Queue 100% Read
16 Thread 16 Queue 100% Write
EXT4 Logical Volume
260
23
ZFS Primary Cache: all
742
199
ZFS Primary Cache: metadata
1275
425
ZFS Primary Cache: none
2092
459
8K Sequential 100% Read/Write Test [Standard Deviation]
16 Thread 16 Queue 100% Read
16 Thread 16 Queue 100% Write
EXT4 Logical Volume
3
0
ZFS Primary Cache: all
3
1
ZFS Primary Cache: metadata
25
13
ZFS Primary Cache: none
41
11
128K Sequential 100% Read/Write Test [Throughput]
16 Thread 16 Queue 100% Read
16 Thread 16 Queue 100% Write
EXT4 Logical Volume
20830
25769
ZFS Primary Cache: all
287079
29784
ZFS Primary Cache: metadata
4456
35186
ZFS Primary Cache: none
4606
32107
128K Sequential 100% Read/Write Test [Average Latency]
16 Thread 16 Queue 100% Read
16 Thread 16 Queue 100% Write
EXT4 Logical Volume
12
9
ZFS Primary Cache: all
1
8
ZFS Primary Cache: metadata
57
7
ZFS Primary Cache: none
55
7
128K Sequential 100% Read/Write Test [Max Latency]
16 Thread 16 Queue 100% Read
16 Thread 16 Queue 100% Write
EXT4 Logical Volume
119
40
ZFS Primary Cache: all
26
57
ZFS Primary Cache: metadata
236
86
ZFS Primary Cache: none
125
255
128K Sequential 100% Read/Write Test [Standard Deviation]
16 Thread 16 Queue 100% Read
16 Thread 16 Queue 100% Write
EXT4 Logical Volume
5
2
ZFS Primary Cache: all
1
5
ZFS Primary Cache: metadata
27
5
ZFS Primary Cache: none
26
7
8K Random 70% Read 30% Test [Throughput]
2 Threads 2 Queues
2 Threads 4 Queues
2 Threads 8 Queues
2 Threads 16 Queues
4 Threads 2 Queues
4 Threads 4 Queues
4 Threads 8 Queues
4 Threads 16 Queues
8 Threads 2 Queues
8 Threads 4 Queues
8 Threads 8 Queues
8 Threads 16 Queues
16 Threads 2 Queues
16 Threads 4 Queues
16 Threads 8 Queues
16 Threads 16 Queues
EXT4 Logical Volume
4004
4504
5767
6943
4328
5718
6838
7658
5694
6883
7719
9284
6754
7675
9375
9227
ZFS Primary Cache: all
50117
37957
45180
45199
46851
56708
56576
66382
38537
46762
46456
40270
38447
42264
40095
40322
ZFS Primary Cache: metadata
4699
345
355
333
562
528
498
496
833
810
837
779
846
798
723
887
ZFS Primary Cache: none
3943
351
343
345
556
474
456
542
665
695
672
746
916
864
1009
968
8K Random 70% Read 30% Test [Average Latency]
2 Threads 2 Queues
2 Threads 4 Queues
2 Threads 8 Queues
2 Threads 16 Queues
4 Threads 2 Queues
4 Threads 4 Queues
4 Threads 8 Queues
4 Threads 16 Queues
8 Threads 2 Queues
8 Threads 4 Queues
8 Threads 8 Queues
8 Threads 16 Queues
16 Threads 2 Queues
16 Threads 4 Queues
16 Threads 8 Queues
16 Threads 16 Queues
EXT4 Logical Volume
0
1
1
3
1
1
3
5
1
3
5
10
3
5
9
23
ZFS Primary Cache: all
0
0
0
0
0
0
0
0
0
0
1
3
0
1
3
6
ZFS Primary Cache: metadata
0
23
45
96
14
31
64
129
19
40
77
165
39
82
179
288
ZFS Primary Cache: none
0
23
47
92
15
34
71
118
25
47
95
171
36
35
128
266
8K Random 70% Read 30% Test [Max Latency]
2 Threads 2 Queues
2 Threads 4 Queues
2 Threads 8 Queues
2 Threads 16 Queues
4 Threads 2 Queues
4 Threads 4 Queues
4 Threads 8 Queues
4 Threads 16 Queues
8 Threads 2 Queues
8 Threads 4 Queues
8 Threads 8 Queues
8 Threads 16 Queues
16 Threads 2 Queues
16 Threads 4 Queues
16 Threads 8 Queues
16 Threads 16 Queues
EXT4 Logical Volume
95
138
166
299
142
162
326
544
211
230
520
1333
302
581
888
1589
ZFS Primary Cache: all
808
661
266
204
31
28
86
15
34
38
36
41
30
52
81
64
ZFS Primary Cache: metadata
914
770
693
963
327
551
865
1597
472
559
758
947
1570
2082
2458
2015
ZFS Primary Cache: none
1465
444
927
942
713
1478
4246
1202
1487
1523
1453
1597
1352
1195
1138
1346
8K Random 70% Read 30% Test [Standard Deviation]
2 Threads 2 Queues
2 Threads 4 Queues
2 Threads 8 Queues
2 Threads 16 Queues
4 Threads 2 Queues
4 Threads 4 Queues
4 Threads 8 Queues
4 Threads 16 Queues
8 Threads 2 Queues
8 Threads 4 Queues
8 Threads 8 Queues
8 Threads 16 Queues
16 Threads 2 Queues
16 Threads 4 Queues
16 Threads 8 Queues
16 Threads 16 Queues
EXT4 Logical Volume
1
2
3
7
2
3
7
14
4
7
15
29
7
14
24
39
ZFS Primary Cache: all
1
1
0
0
0
0
0
0
0
0
0
0
1
1
2
4
ZFS Primary Cache: metadata
5
22
27
61
14
29
61
102
20
36
63
101
62
140
274
248
ZFS Primary Cache: none
8
17
41
51
21
63
128
68
58
83
145
138
56
45
109
191
Final Thoughts
All of the solutions below either support inline deduplication/compression or will in the very near future. I've had a couple of them priced just to give people an idea. The Dell pricing is indicative whereas the pricing for the Nimble SAN controller upgrade/All Flash Array are current as of May 9th 2017.
Obviously, more thought should go into picking one of these solutions than just price. Other than the amount of raw disk space each solution provides, what's below really isn't an apples to apples comparison. The SAN based solutions include other tools like 4Hr support, predictive analytics, proactive monitoring, easy to use storage management tools, capacity planning and much more which do help to justify the additional expense. An in-house solution will mean in-house support and even with my current knowledge of ZFS, i'm not 100% confident that i could fix it in an emergency 100% of the time within a reasonable time frame.
With ZFS we still need to be concerned about its RAID configuration but from what i've read so far, it's not as complicated as it is for most servers/SANs (Nimble excluded) but still it's one more thing to learn and understand. While most Systems Administrators would be able to come up with a sensible configuration by themselves, i'm not sure all of them would be able to.Of course, you can ask yourself the question "How often does one need to do that?" and it's safe to say not often. It's still something worth keeping in mind though.
Ultimately, ZFS would be very useful for us IF used correctly but the risks make it difficult to justify its use for production systems/storage in my opinion. These risks should be mitigated as OpenZFS matures but it's not quite there yet.
Hardware Recommendations
To recap, these are the hardware stats for the test server so you don't have to scroll up.
OS storage configuration - 600GB raw storage consisting of 2 x 600GB 15K RPM SAS 6Gbps 2.5in drives in RAID 1
Data Storage configuration - 1.8TB raw storage consisting of 6 x 600GB 15K RPM SAS 6Gbps 2.5in drives in RAID 10
The test server performed quite well during testing. I'd probably recommend dual CPU's. ZFS runs quite a few processes so being able to run them on their own logical core is quite handy.
RAM-wise, i'd probably recommend going with 64GB of RAM to begin with. Having said that, if you can add more ram, do it. The more RAM you have, the more data you can cache in it.
If you can stretch the budget a bit more, an SSD drive (one is ok) can be used as a secondary cache. This will help reduce the need to read from the spinning disks directly.
Finally, and this is an absolute MUST HAVE in my opinion. You need a SAS controller card capable of JBOD mode. While we didn't use one in testing (Because we didn't have one), you really should look into it. ZFS has it's own storage management system and it compliments the ZFS filesystem perfectly. Let ZFS manage the RAID and you'll be rewarded.
Price Comparisons
Below is a price comparison of some of the options we have on the table at the time of writing. All prices are in AUD and are inclusive of GST.
Connect your modem/router to your NBN battery to have internet even during a power outage. This guide will show you how.
Ever been through a power outage and wished you still had internet? Tick.
Looked at the battery backed FTTP NBN boxes and wished your router had battery backup? Tick.
Started wondering "If i had battery backup for my router, i'd still have internet..." - Tick.
If you have the Coalitions' Multi Technology Mix FTTN NBN. Stop right here. YOU SHALL NOT PASS!
If you're lucky enough to have FTTP NBN with battery backup, you can probably have internet at all times too.
Tools Required
Wire Strippers
DC Volt Meter (A Multimeter)
Wire Cutters
Electrical Tape
20 minutes
and in my case, the biggest tool of them all, me.
Before We Get Started
First of all, have a look at your router. The power socket should have something like "12v Xa" written on it. If it does, you're in luck and we can continue. If you can't find it, you may need to google your model of router and find its power specifications. As long the routers input voltage is 12 volts, you should be fine.
Turn off your router and disconnect the power to it.
Disconnect the power from the wall socket.
Open the battery backup unit cover and remove the battery from its holder. This will make it easier to work on.
Identify The Wires
Your routers' power cable is actually made up of two separate wires. It's now time to cut the cord and figure out which one is the positive and which is the negative. Separate the two wires and strip them. Make sure the bare wires DO NOT TOUCH!
Be VERY careful at this point! Use your volt meter on the volts DC mode and touch the leads to the wires. If you get a positive number, your red lead is on the positive wire. If you receive a negative number ie -12.XX then your red lead is on the negative wire.
Keeping enough to connect to the battery, cut the cord to the power adapter because your not going to need that anymore. You can of course skip this step but you'll have to be VERY diligent about keeping the power pack disconnected. Who knows what it'll do to your router or the NBM equiment if you do.
Be VERY careful at this point! Strip a small section of wire from each of the leads. A wire stripper like the one above will make this task really easy without damaging or cutting the existing wires. Always try to stagger your wire connections so you don't end up with a lump of tape in one area. They're also less likely touch each other.
Connecting Your Router To Battery Backup
Now you know which lead is your positive and which is your negative, you'll be able to connect the positive wire to the positive wire on the NBN battery and the negative wire to the negative wire connected to the NBN battery. Wrap the connections in electrical tape and your done.
The Moment Of Truth
Connect the power to the router and turn on your router. If your connections are solid, your router should turn on and power up running directly off the battery.
The next time you have a power outage, your router will still be online. By the way, the entire time i've been writing this article, i've been running off the NBN battery!
Disclaimer
The Ignorant IT guy takes no responsibility for any damage you cause to your equipment, NBN Co equipment or yourself. Don't come crying to me if your shit blows up or you zap yourself.
Will NBN Co allow this kind of setup? Probably not...
To most, the Australian National Broadband Network (NBN) is an unnecessary burden on the economy dreamt up by self serving politicians trying to win votes. Some of those same people also believe the NBN will only be useful to those who download illegal content or watch porn.
In this two part article, we're going to talk about how the NBN will affect you even if you oppose the project. We'll also discuss the key differences between Fibre To The Premise (FTTP) NBN and Fibre To The Node (FTTN) NBN. Finally, we'll look at a couple of real world use cases that you probably weren't aware of but will damn sure want to take advantage of. All with the typical IITG spin that will make this article just a little less shit.
The politically bias among us will no doubt cry one way or another but it's important to remember one thing; i hate all political parties equally. Yes, even yours.
What Is The NBN?
In a nutshell it's high (or in some cases highER) speed internet for all. The kind of internet which can be easily upgraded at relatively low cost to the taxpayer and has a longer shelf life than our existing forms of fixed broadband such as copper or cable.
The coalition stated that their NBN will be delivered quicker and cheaper than the now redundant labor NBN. It makes you wonder why we don't build more government projects with that mentality.
Roads can be delivered quicker and cheaper if we only use dirt.
Trains and buses can be delivered quicker and cheaper without seats.
Hospitals beds can be delivered quicker and cheaper if patients sleep on the floor.
Exotic dancers can... ummm... well, you get my point.
Connecting To The NBN. Will It Be Easier?
When you move into a new home, its often a mission to not only locate the correct wall socket but also verify whether the router and cable from your old house will work in your new house. When it doesn't, its off to the shops to buy the necessary cable/converter. Given the time wasting nature of the exercise i expect complaints laden with plenty of expletives thrown in for good measure. Unfortunately for some, this process will not change under the existing FTTN rollout.
We've all had to look for at least one of these at least once in our lives
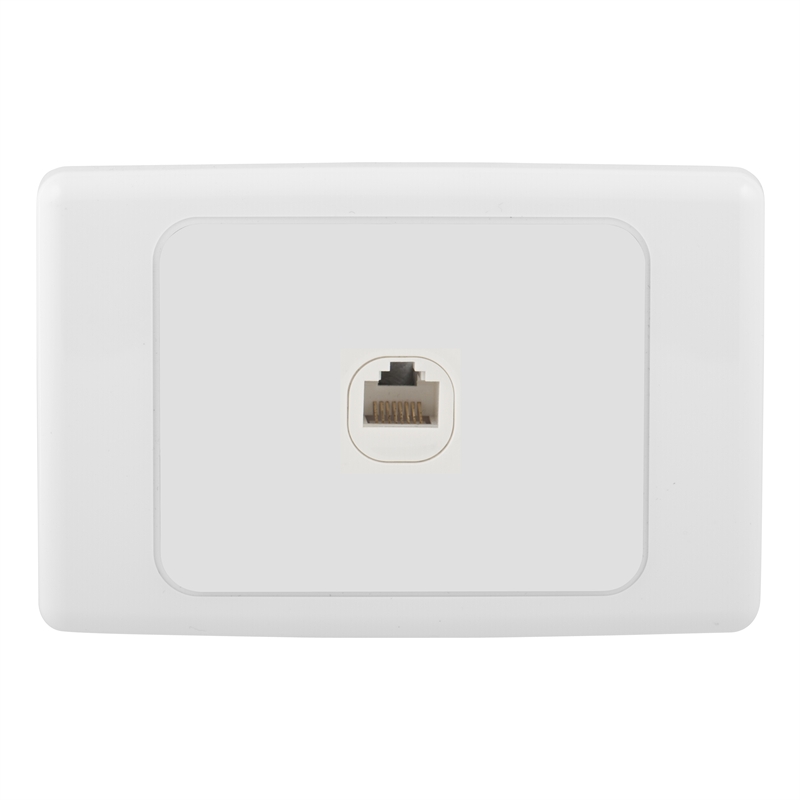
FTTP on the other hand leaves you with a gray box in your home with an RJ45 jack waiting for your router to be plugged into it. Simply plug in an appropriate router and your done.
Find this pair of boxes somewhere in your house or garage and.....
Aim your cable for that port and you can't really go wrong.
Yeah, you heard me! no configuration, no username or passwords and no fancy settings to deal with. We've gone from having to deal with a telephone cable, adapter, inline filters etc to buying one RJ45 cable! ONE CABLE! The next time you move to another FTTP home, you'll know to look for and what to do.
How Much Speed Do I Really Need?
Before we can review how much speed is truly necessary, it's important for us to define how much each technology is capable of delivering.
Both FTTN and FTTP are capable of delivering 100 Mbps of download bandwidth. However, in a University of Melbourne study titled Broadband Facts, Fiction and Urban Myths, Figure 6 shows how quickly FTTN speeds deteriorate based on your cabled distance from the node. This explains why it must have been important for the coalition to reassure the public that they are "absolutely confident that 25 megs is going to be enough". It has to be or else they're going to be in trouble.
At 34:53 Tony Abbott tells YOU how many megabits per second YOU need.
FTTP on the other hand does not have this limitation. 100 Mbps download (and eventually 1000 Mbps) is achievable as long as you have FTTP in the first place. In a recent news.com.au article it has also been the deciding factor for one particular couple who work from home. Should the couple move again they agreed they will favour locations with FTTP.
With the car manufacturing industry faltering in South Australia. The SA state government have decided they will aim to create a 10Gb or 10,000 Mbps city which they hope will attract businesses, residents and knowledge economies. Let's be honest, if you're a Netflix or an Apple Computer Inc, a 10Gb city with a more affordable property market starts to look VERY appealing. Opening an office or datacenter isn't the only reason, it's all those potential customers with super fast internet who you'll want to sign up to your latest streaming service.
Whichever way you slice it, the internet of tomorrow is going to need to be capable of delivering multiple Full HD 1080p streams (5 - 9 Mbps per stream) and the odd 4K video stream (requires >25 Mbps per stream), web browser traffic (2 - 3 Mbps) and downloads (everyone downloads something!) to the majority of households in Australia. Compare this to today's paltry 24 megabit per second maximum theoretical speed of ADSL2+ quoted by EVERY internet service provider in Australia. The speed that's only really possible if your house is the same distance from the exchange as the average length of a pubic hair.
What About Wireless?
With 4G networks becoming faster than some peoples home internet connection and 5G on the way, it's totally understandable to think that wireless is the way of the future and number one contender to replacing fibre. Let's start by breaking down wireless into terms everyone can understand to see whether it really is better than fibre.
There can be multiple highways (3G highway, 4G highway, 5G highway etc) run by your mobile carrier (Vodafone, Optus etc). Your phone will try to connect to the fastest highway it can but your mobile carrier will dictate
Where you can enter the highway (mobile towers)
The maximum speed limit you can travel at
Number of lanes you can use (radio frequency spectrum)
Just like a normal highway, there are many more users during peak hour so you can't always travel at or close to the maximum speed. Also, what happens when others find out your highway performs better? They upgrade their mobile device and/or change carrier and suddenly there's more congestion and traffic begins to move slower and slower. Suddenly your seeing speeds of only a few Mbps! Where did the other 90 something megabit? Never forget that maximum theoretical speeds are pretty useless in the real world. Japan's NTT breaks fibre optic data speed record setting a maximum throughput rate of 1 Pbps or 125,000,000 Mbps.
Finally, the faster the highway, the closer you need to be to its entrance in order to use it. Don't forget that obstructions like walls etc will essentially move you further away from the entrance and force you to use a highway with less lanes and a lower speed limit.
This is what a Wireless NBN would probably look like if some have their way
Figure 12 in Broadband Facts, Fiction and Urban Myths shows fibre capable of speeds 10,000 times greater than the entire radio spectrum. What the graph doesn't tell you is that speed can be allocated to a single user. Imagine having a highway that's completely dedicated to you and only you and now your starting to see the power of fibre.
As we move closer towards an "internet of things" where more things are connected to the internet, it's likely we'll still see congestion and interference. Also, with relatively low bandwidth quotas, and quite expensive rates if you exceed them, I'm not confident it will be the silver bullet for those who champion wireless as the technology of the future.